Nvidia booked about $130 billion of operating income in fiscal 2026. Every one of those chips still has to be plugged into something. That is why AI data center power demand is turning into a second, less crowded AI trade: the companies that cool, connect, transform and generate the electricity. This article compares four of them with filed numbers, separates reported results from what the share price already expects, and walks through three scenarios for 2027 to 2029. Everything below is my personal analysis and projection, not investment advice, and every number is dated.
What you get from reading it: a one-table scorecard of Vertiv, GE Vernova, Quanta Services and Hubbell; a simple backlog-coverage calculation you can repeat on any industrial stock; three load scenarios with what has to be true for each; and a short list of financial checks that matter more than the headline backlog figure. Data are as of October 18, 2026 unless noted.
How big is AI data center power demand, really?
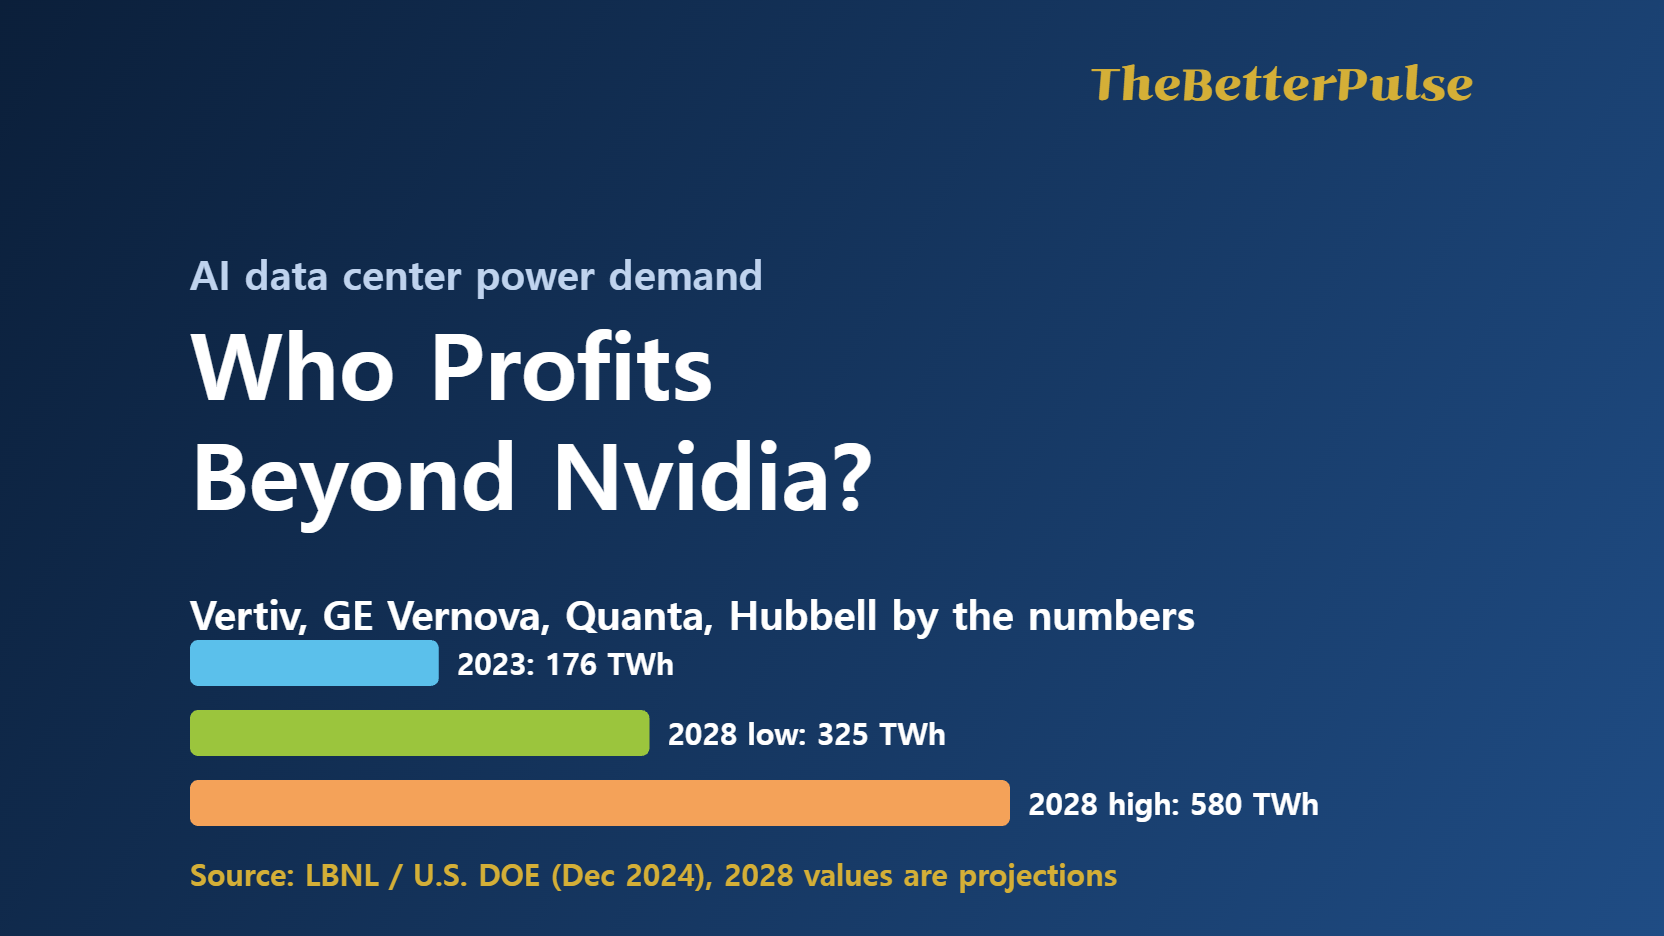
Start with the physical numbers behind AI data center power demand. Lawrence Berkeley National Laboratory’s December 2024 report for the U.S. Department of Energy found that U.S. data centers used 176 TWh of electricity in 2023, about 4.4% of the national total, up from 58 TWh in 2014. It projected 325 to 580 TWh by 2028, or roughly 6.7% to 12% of U.S. electricity. Spread over 8,760 hours, that is an average load of about 20 GW in 2023 and about 37 to 66 GW in 2028. The EIA’s October 2026 outlook now expects record U.S. generation of 4,368 billion kWh this year, up 2.2%, and cites data centers as a driver of commercial-sector demand growth of 2.8% in 2027.
| Metric | Value | Source and date |
|---|---|---|
| U.S. data center electricity, 2014 | 58 TWh | LBNL / DOE, Dec 2024 |
| U.S. data center electricity, 2023 | 176 TWh (4.4% of U.S. total, about 20 GW average load) | LBNL / DOE, Dec 2024 |
| U.S. data center electricity, 2028 range | 325 to 580 TWh (6.7% to 12%, about 37 to 66 GW) | LBNL / DOE, Dec 2024 |
| U.S. generation, 2026 forecast | 4,368 billion kWh, +2.2%, record | EIA, Oct 2026 |
| Global data center electricity, 2024 and 2030 base case | about 415 TWh, then about 945 TWh | IEA, Energy and AI |
| Big-four cloud capex, 2021 and 2025 | $128.3 billion, then $408.9 billion (3.2x) | Company 10-K filings via SEC XBRL, TBP analysis |
Beyond Nvidia: where AI data center power demand turns into profit
Follow one dollar of AI spending downstream. After the GPU come cooling and power distribution inside the building (Vertiv), the transformers, switchgear and gas turbines that feed the site (GE Vernova), the crews that build lines and substations (Quanta Services) and the electrical components in between (Hubbell). Their filed results show a very different profit structure from Nvidia’s.
| Company | Revenue, first year to latest year | Revenue CAGR | Operating margin, latest year |
|---|---|---|---|
| Nvidia (FY2022 to FY2026, Jan year-end) | $26.9B to $215.9B | 68% | 60.4% |
| Vertiv (2021 to 2025) | $5.0B to $10.2B | 19.6% | 17.9% |
| GE Vernova (2023 to 2025) | $33.2B to $38.1B | 7.0% | 3.7% (1.3% in 2024) |
| Quanta Services (2021 to 2025) | $13.0B to $28.5B | 21.7% | 5.7% |
| Hubbell (2021 to 2025) | $4.2B to $5.8B | 8.7% | 20.7% |
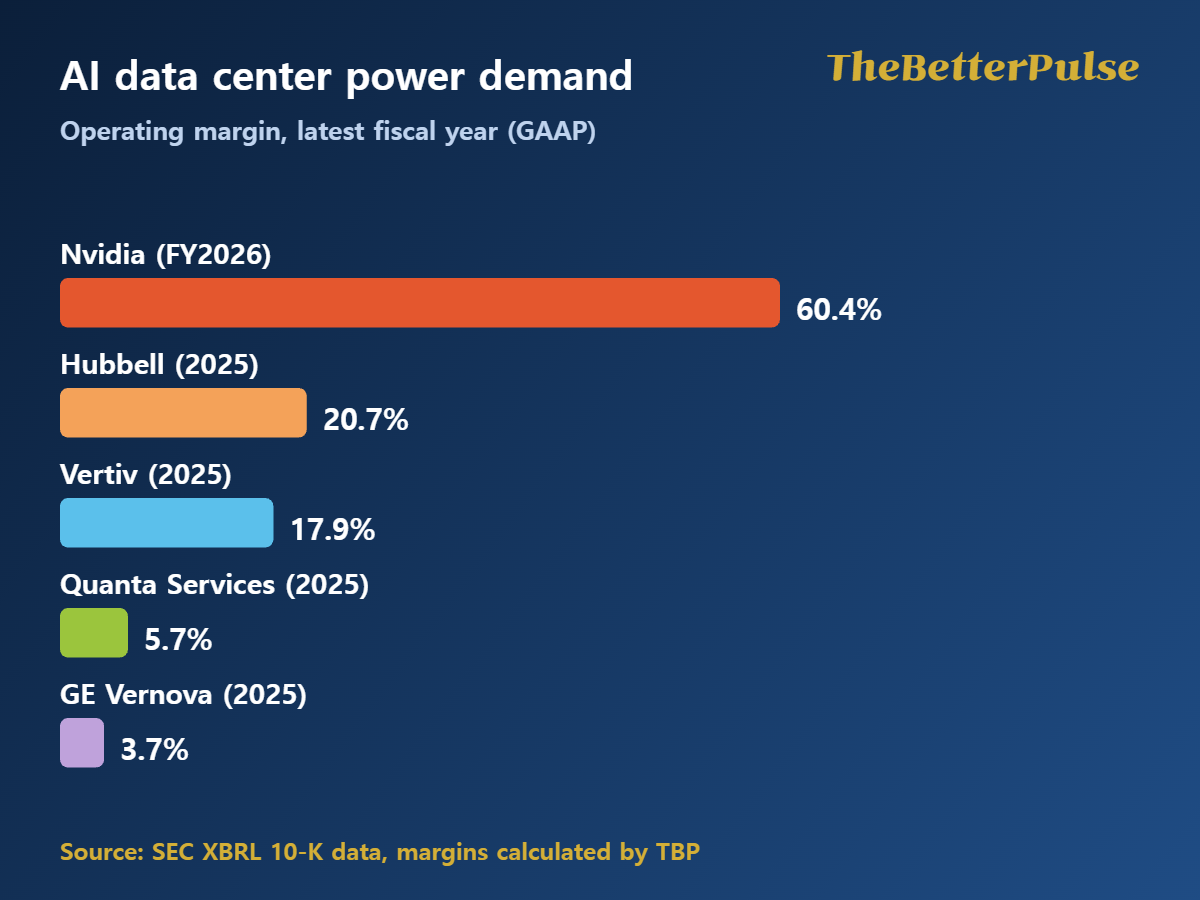
The takeaway is not that grid equipment is a worse business. It is a different one. Vertiv’s operating margin has roughly tripled since 2021 because it sells products with pricing power into a supply-constrained market. Quanta and GE Vernova earn thin margins on much larger revenue bases, so small changes in execution move profit a lot. For readers who want the broader capex picture first, TBP’s earlier analysis of the big-four cloud spending is linked below.
Reported results versus what the stock already expects
Backlog is the number everyone quotes when they talk about AI data center power demand, and it is the easiest to misread. GE Vernova reported a total backlog of $176 billion at June 30, 2026, split roughly half equipment and half services, with $24.2 billion of second-quarter orders, up 88% organically. About 80% of its gas turbine capacity under contract is for traditional customers and about 20% for data centers, and its Electrification segment booked more than $5 billion of data center orders in the first half, more than double all of 2025. Quanta’s total backlog reached a record $53.4 billion, but it includes estimated orders under master service agreements and is a non-GAAP figure. Vertiv’s backlog was $15.0 billion at the end of 2025 (book-to-bill about 2.9x), though its second-quarter 2026 backlog figure was not available in the sources I could verify.
| Company | Latest backlog | Backlog divided by 2025 revenue | Price change, 12/31/2025 to 10/16/2026 | Below 52-week high |
|---|---|---|---|---|
| GE Vernova | $176B (Jun 30, 2026) | 4.6x | +40.9% | -21.6% |
| Quanta Services | $53.4B (Jun 30, 2026) | 1.9x | +49.7% | -19.5% |
| Vertiv | $15.0B (Dec 31, 2025) | 1.5x | +27.4% | -45.1% |
| Hubbell | Not compared here | n/a | +3.8% | -17.3% |
| Nvidia (reference) | n/a | n/a | +14.8% | -10.5% |
Now compare price with profit. Since the end of 2021, Quanta’s share price rose about 5.5 times while its operating income rose about 2.4 times, so most of the gain came from a higher valuation multiple, not from earnings. Vertiv’s price rose about 8.3 times against operating income up about 7.0 times, a much closer match, yet the stock sits 45% below its 52-week high. That gap is the market asking whether the order book converts: Vertiv’s guidance of about $14.0 billion for 2026 implies second-half sales growth of roughly 45% after growth of 27% in the first half, so second-half execution is the test.
Three scenarios for AI data center power demand, 2027 to 2029: my personal analysis and projection
I use the LBNL 2028 range as the anchor and ask what each end implies. The compound growth rates below start from 176 TWh in 2023. The scenario labels, the “what has to be true” column and the effect on company results are my personal analysis and projection, not forecasts from LBNL or any company.
| Scenario | U.S. data center load in 2028 | Implied growth, 2023 to 2028 | What has to be true | Likely effect on power-equipment names |
|---|---|---|---|---|
| Digestion | 325 TWh (6.7% of U.S. electricity, about 37 GW) | 13.1% per year | AI capex plateaus, projects slip on grid connection delays, financing tightens | Orders slow, backlog converts but is not replaced, multiples compress |
| Base | About 450 TWh (midpoint, about 52 GW) | 20.8% per year | Capex keeps rising but more slowly, interconnection stays the bottleneck | Backlog converts steadily, margins hold, returns depend on valuation |
| Build-out | 580 TWh (12% of U.S. electricity, about 66 GW) | 26.9% per year | Capex stays high through 2029, new generation and grid capacity arrive on time | Orders and margins keep rising, execution and supply chains become the limit |
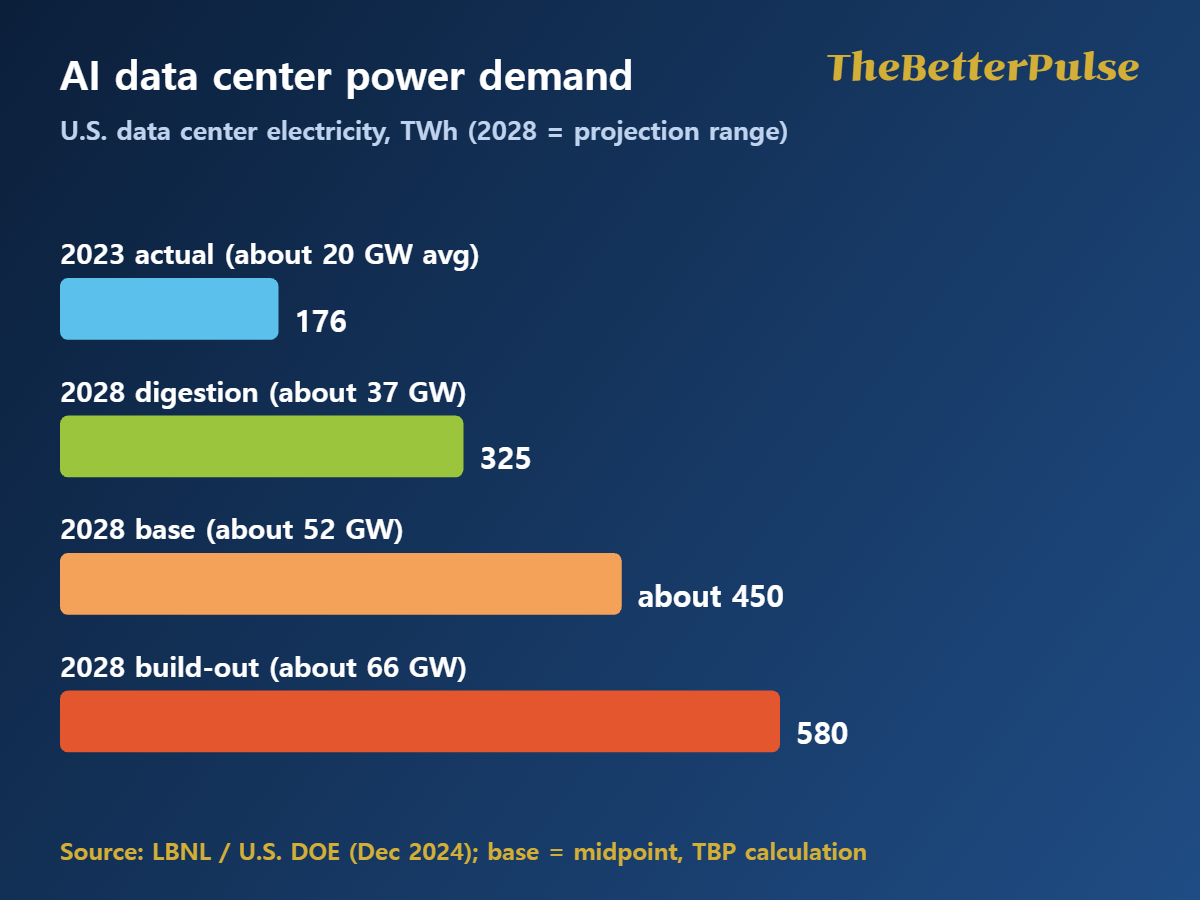
The asymmetry matters more than the label. In the digestion case AI data center power demand still roughly doubles from 2023, so the equipment makers do not collapse, but stocks priced for the build-out case can fall a lot. The EIA also notes a pause in new data center projects in Texas, which shows how local power limits can change timing even when national demand grows.
Financial checks that matter more than the headline backlog
Before buying any AI power-infrastructure stock, I would check six things, in this order. First, backlog divided by annual revenue, and how much is services versus equipment. Second, book-to-bill over several quarters, not one. Third, operating margin trend, because rising orders with falling margins signal weak pricing. Fourth, free cash flow conversion, since Vertiv generated adjusted free cash flow of $925 million in the second quarter on $738 million of adjusted operating profit, while capital-intensive builders can show the opposite. Fifth, customer concentration, because a few hyperscalers drive most orders. Sixth, price versus earnings: if the share price has risen several times faster than operating income, the stock needs the optimistic scenario to deliver.
Risks to AI data center power demand, and to the stocks that serve it, that sit outside the spreadsheet include tariffs on imported electrical equipment, transformer and turbine lead times, interconnection queues, local opposition to new data centers, and the possibility that AI customers cut capex if returns disappoint. A fall in AI demand would hit these companies later than chipmakers, because backlog delays the effect, but it would hit them eventually.
Conclusion: what you gain, when it works, and what to do first
What you gain is a way to look past Nvidia without guessing. Physical demand for AI data center power demand is very likely to keep growing under every LBNL scenario, but the investment return depends on whether a company converts backlog into profit at a price you did not overpay. This approach suits an investor with a multi-year horizon who can tolerate drawdowns of 20% to 45% like those above. It suits less an investor who needs the money within a year, because Vertiv, GE Vernova and Quanta all sit well below their highs despite record backlogs.
Your first action takes ten minutes. Open the latest earnings release of any company you own or watch, find backlog, revenue and operating income, and calculate backlog divided by revenue and operating margin as in the tables above. Then compare how much the share price has risen against how much operating income has risen. If the first number is far larger, decide which scenario you are actually betting on before you buy more.
This article is my personal analysis based on public filings, company releases and government reports, provided for information only. Scenarios and projections are my personal analysis and projection, not guarantees. It is not investment advice and does not recommend buying or selling any security. Market data change quickly. Any decision and its consequences are the reader’s own responsibility. I used AI assistance in drafting and verified figures against the sources listed.
Related reading
AI hegemony 2027 to 2029: who makes the money (Korean-language analysis of big-four cloud capex)
Sources and official references
Lawrence Berkeley National Laboratory: United States Data Center Energy Usage Report (2024 and 2025 update)
U.S. EIA: record electricity generation expected in 2026 and 2027 (Oct 15, 2026)
IEA: Energy and AI, energy demand from AI
GE Vernova: second quarter 2026 results (SEC 8-K exhibit 99)
Quanta Services: second quarter 2026 results
Vertiv: fourth quarter 2025 results (backlog)
Vertiv: second quarter 2026 earnings release
SEC EDGAR XBRL company facts API (10-K revenue and operating income)
#AIDataCenterPower #GridEquipment #GEVernova #Vertiv #QuantaServices